Eyes in the Sky: Advanced survey technologies give 20/20 view of remote assets

By Will Fellers
Remote sensing technology has come a long way and is delivering serious benefits across a wide range of industries. Since the early 1970s, when the first LANDSAT satellites were launched, there has been rapid technological innovation in platform architecture and sensor technology used to collect both active and passive spectral information.
These advancements have dramatically changed the way we collate, interpret and act on geographic information system (GIS) data in virtually every discipline and in our day-to-day lives. Efficiencies in data acquisition coupled with revolutionary improvements in analytic platforms have pushed remote sensing technology to the forefront of scientific and business-critical decision making, delivering insights not previously possible.
Let’s examine how new sensor technologies, acquisition platforms and high-performance, cloud-based computing enable greater visibility and provide detailed data that enhances public safety, improves reliability of critical infrastructure and supports proactive planning.

Figure 1. Time-lapse of fixed-wing aircraft collecting near-shore topobathy lidar after Superstorm Sandy near Holden Beach, North Carolina. (Photo: Brett Murphy)
A Sample of the Latest Technologies
Remote sensors work by recording the radiance of specific wavelengths of the electromagnetic (EM) spectrum tuned for particular applications. Today, sensors of all sizes, types and designs — accommodating an almost limitless variety of spectral bands and fusion of these bands — are being deployed for an array of remote sensing applications.
There are two general types of sensors: active, which transmit and record their own light source; and passive, which measure reflected or emitted energy produced from an external source. Most modern sensors are integrated with inertial navigation systems (INS) and global navigation satellite systems (GNSS), which provide high-precision and spatially accurate data. Active sensors also can provide extremely accurate range information for detailed 3-D applications, while 2-D passive sensors, relying on relatively new techniques using structure from motion (SfM), can achieve similar ranging capabilities.
Among the types of active and passive sensors in mainstream use today are:
- Topographic lidar. Best known for producing highly accurate 3-D point cloud data, it is used for topographic and above ground analyses, 3-D reconstructions and advanced artificial intelligence applications.
- Topobathy lidar. A specialized airborne sensor capable of penetrating water to map underwater surfaces. It also offers the potential to simultaneously map land and sea floor and reaches areas too shallow for survey boats.
- Thermal Imaging. It records radiation emitted from objects and differences in temperature across a scene.
- Multispectral Imaging. It measures energy within specific bands of the EM spectrum, most commonly visible blue, green and red, as well as near infrared.
- Hyperspectral Imaging. Capable of collecting visible to long-wave reflected solar energy across more than 200 bands. With each additional band of information, the data dimensionality grows and increases the potential for discriminating specific materials based on diagnostic spectral features.
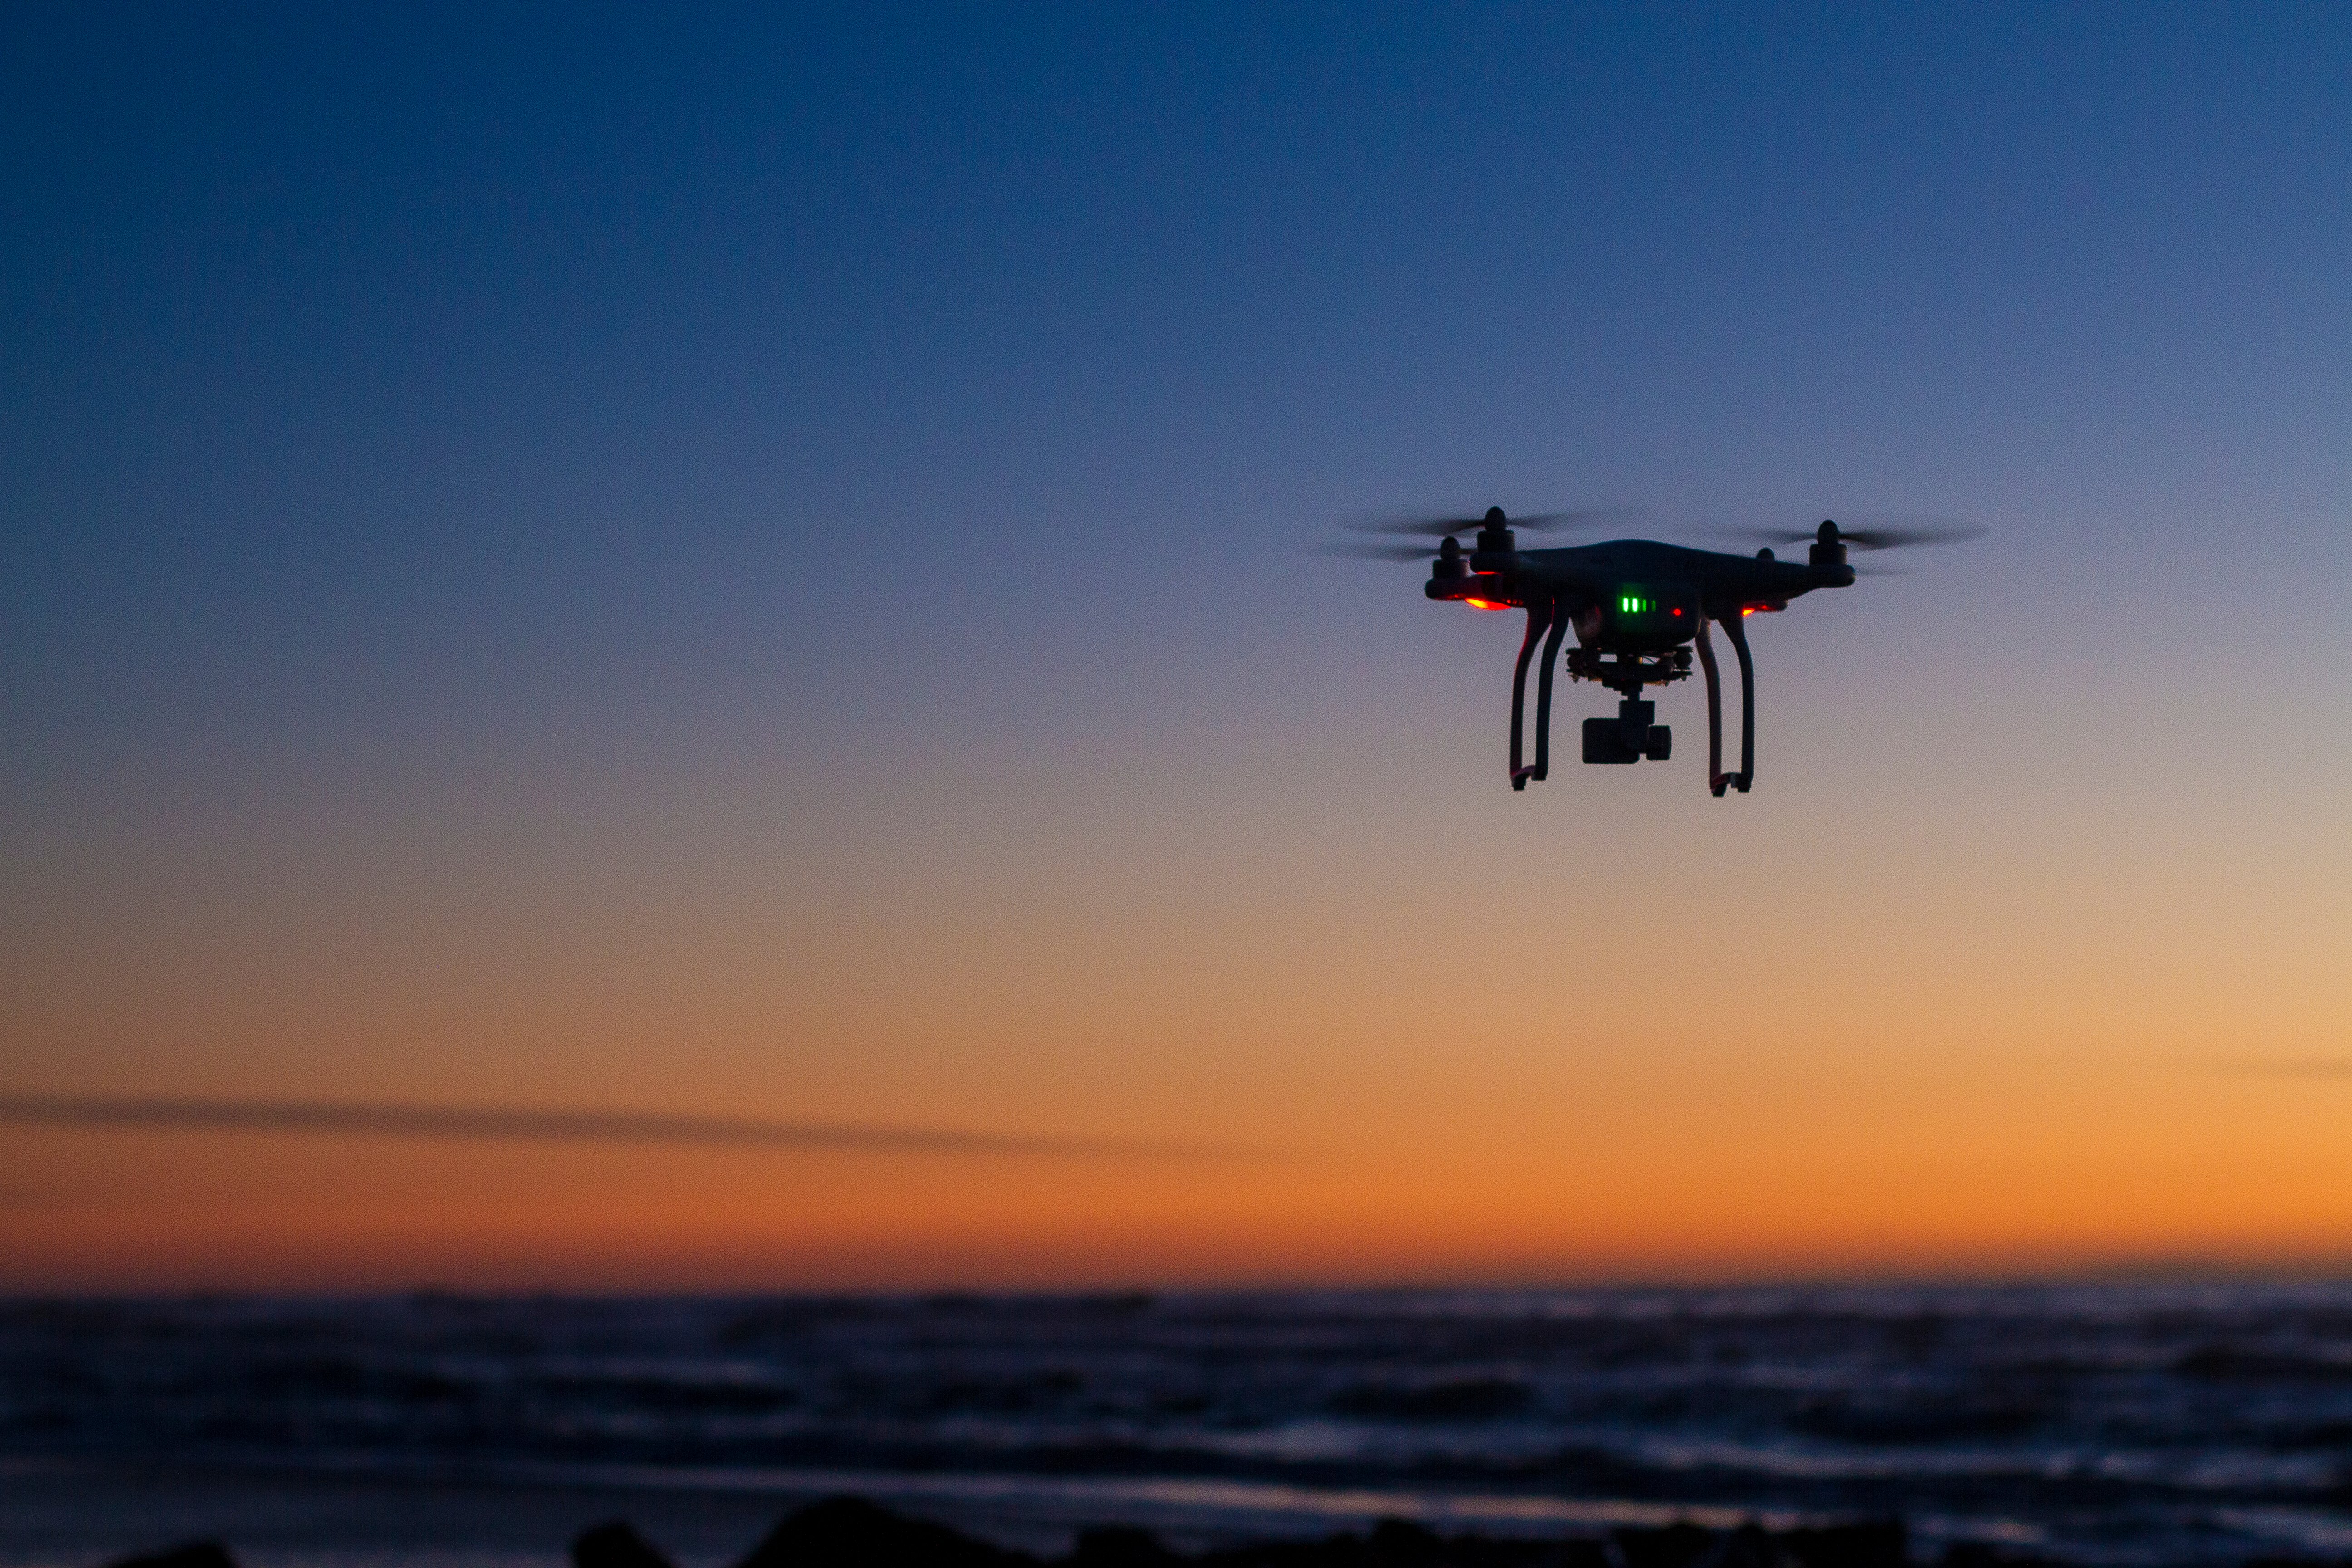
When evaluating new remote sensing tools, sensor technology innovation is only one piece of the puzzle. The platforms that carry these sensors are also rapidly evolving. Manufacturers are producing cheaper and lightweight versions of sensors making it possible to mount them on compact satellites, unmanned aerial vehicles (UAVs), automobiles, handheld devices and autonomous robotic vehicles.
How to Use and Interact with Remote Sensing Data
Recent trends in data fusion and multitemporal data analysis are leading to new approaches and solutions to complex geospatial problems. We can now acquire, combine and analyze data in ways that allow us to do even more things. But, users also are faced with challenges in managing the ever-increasing data volumes, and associated storage and processing capabilities, that come with higher spatial resolution, increased point densities, collection of hundreds of spectral bands and fusion with other data sources.
The rise of cloud-based and high-performance computing environments enable new rapid data processing and retrieval techniques. Historically, the volume of data from hyperspectral sensors made it difficult to quickly analyze and derive actionable information. Only recently has computing power caught up to sensor technology, enabling data analysis for vast areas in a reasonable time frame.
Now that large amounts of data can be converted into high-quality analytics, consumers require an organized, intuitive and integrated delivery mechanism to fully leverage the intrinsic advantages of the extracted information. These needs are being addressed by integrated cloud-based platforms that rapidly update and distribute intelligence across organizations.
Remote Sensing in Action
Many applications, like the ones below, historically relied on antiquated collection platforms or time-consuming manual data collection and interpretation. Now, technological advancements in remote sensing are being leveraged to address diverse and complex problems.
Hurricane Sandy: Near Shore, Post-Disaster Survey
In 2012, Superstorm Sandy grew to the largest Atlantic hurricane on record, affecting the entire Eastern Seaboard from Florida to Maine and moving west across the Appalachian Mountains to Michigan and Wisconsin. Damage was estimated at more than $63 billion, the second costliest hurricane in United States history.
Following the storm, the U.S. National Oceanic and Atmospheric Administration (NOAA) National Geodetic Survey required collection and processing of airborne topobathy lidar and multispectral imagery. The data collected would enable accurate and consistent measurement of the national shoreline for coastal zone management, inundation modeling, habitat mapping and restoration purposes. In less than six months, the NOAA project team, of which Quantum Spatial Inc. (QSI) and Dewberry were members, successfully mapped more than 2,772 square miles of shoreline encompassing the outer coastline from New York to South Carolina.
The airborne topobathy lidar enabled the rapid survey of shallow water areas that are difficult, dangerous or impossible to reach using water-borne platforms. They also were able to collect topographic and hydrographic data concurrently to provide seamless data from land to water (see Figure 2).

Figure 2. Lynnhaven Inlet, Virginia Beach: Lidar point cloud collected from a single topobathy acquisition flight. Topographic data shown in grayscale and subsurface water depth in bluescale.
Water Infrastructure: Leak and Corrosion Detection
In 2016, a municipal water district expressed interest in a technology that could help solve ongoing concerns about underground water leaks and infrastructure corrosion. QSI engineered a solution incorporating lightweight thermal and multispectral sensors mounted on a UAV operated by 5-D Robotics in a pilot program.
The plan was to simulate a leak by pouring a bucket of water near the pipeline and image it over the course of a few hours to show the thermal response of soil moisture. The UAV also flew over the rest of the site to build a SfM 3-D point cloud, identify signs of degradation and map leaks on the reservoir. Within 24 hours of data acquisition, not only was the simulated leak detected, but an actual leak was detected from an underground pipe 10 feet from the simulated leak (see Figure 3).
The survey also revealed water leaking on the surface of a reservoir cover, rust on pipes and tanks, and identified a cracked cap on a tank pressure release valve. One limited drone operation generated the exact information that is supposed to be identified in monthly manual inspections, yet had not been noted by the professionals.

Figure 3. Visible multispectral (left) and thermal imagery of active water leak collected from a UAV.
Forest Assessment: Species and Tree Health
Last year, QSI partnered with Davey Resource Group to classify individual tree types and health for a 2,500-acre area in the Louisville, Ky., metro area. Specifically they wanted to identify and assess ash trees because of damage caused by the emerald ash borer.
Individual tree crowns were separated from one another with automated tools using lidar point-based segmentation routines. At the same time, powerful machine-learning algorithms were used on co-acquired hyperspectral data to both classify and assess canopy stress at the pixel scale (see Figure 4). Typically it would take foot patrols months or years to take only a partial sampling of a survey area this size. However, within a matter of weeks, QSI was able to detect individual trees across the entire area, and classify the dominant tree types with an overall accuracy of 83 percent.

Figure 4. Lidar data from Louisville, Kentucky, colored by tree type (above) and health (below).
Railway Mapping: Asset Inventory & Change Detection
Beginning in 2014, a leading transportation company began continually collecting 3-D data along along its railways using lidar sensors attached to specially equipped geometry cars. Last year, QSI was tasked with rapidly analyzing the raw data to develop a baseline asset inventory of important infrastructure, including signage, signals, track locations, vegetation encroachment and road crossings. Following the initial inventory, data from serial acquisitions were then leveraged to monitor changes along the railway corridor.
Advanced machine learning algorithms were used in a parallel processing environment to rapidly ingest and classify the lidar point cloud for multiple time frames. Using the same cloud-based processing utilities, QSI provided automated difference reporting a few days after new point lidar data was collected. A web-based platform was then used to distribute and visualize the analytic results in an interactive 3-D environment (see Figure 5).
Most rail companies lack an accurate spatial inventory of assets given the cost of ground-based surveys or methods requiring manual interpretation of imagery. Machine learning, parallel processing and automated 3D change detection offer new ways to catalog and track assets in near real-time to address maintenance and safety along entire corridor networks.

Figure 5. Lidar point cloud viewer showing changes detected along a rail corridor between two years of acquisition flights.
Pipeline Monitoring: Integrity Analysis
On the North Slope of Alaska, above-ground pipeline supports are subject to settlement and heave due to the yearly freeze/thaw cycle, loss of permafrost, as well as water movement and other terrain failures. Routine inspections of pipelines are required to identify areas of stress that exceed established tolerances. However, limited access and rugged terrain make it difficult to do ground surveys and manual inspections.
Since 2014, QSI has conducted annual aerial patrols in Alaska utilizing high-density aerial lidar to map pipelines and support structures in detail. Precise pipeline elevation values at supports are automatically extracted and analyzed to find areas of stress and potential for failures. Recurring surveys monitor changes at specific structure over time, providing integrity managers powerful planning tools to identify risks before significant damage occurs (see Figure 6).

Figure 6. Lidar point cloud of pipeline pumping station near Prudhoe Bay, Alaska.
Conclusion
Innovations in remote sensing technology and platforms, such as UAVs and robots that can carry sensors, have coupled with cloud-based, high-performance computing environments to enable new applications for data collection and analysis. With these advancements, organizations of all types now can quickly access mission-critical, actionable information that enables them to protect critical infrastructure, ensure public safety and improve the reliability of their operations.
Will Fellers is product manager for Quantum Spatial Inc. Since 2006, Will has spearheaded the technical development of a comprehensive set of innovative products utilized across technical platforms at Quantum Spatial. He and his team are focused on state-of-the-art solutions for remote sensing applications using machine learning/artificial intelligence systems, advanced data analytics, high-performance cluster computing, immersive 3-D environments and cloud-based data distribution models.

About the Author: Tracy Cozzens
Senior Editor Tracy Cozzens joined GPS World magazine in 2006. She also is editor of GPS World’s newsletters and the sister website Geospatial Solutions. She has worked in government, for non-profits, and in corporate communications, editing a variety of publications for audiences ranging from federal government contractors to teachers.


Subscribe to GPS World
If you enjoyed this article, subscribe to GPS World to receive more articles just like it.


Follow Us